McDonald’s 2014 Monopoly Game Odds Analysed

McDonald’s is running their annual Monopoly Game until the end of the month. The highest prize is $1,000,000 – which goes to the lucky soul who’s able to find the coveted Boardwalk stamp amongst the 651,841,628 game pieces. That equates to every person in the US eating 2 Big Macs before the prize is guaranteed to be given out. Even the odds of winning the Powerball jackpot are higher (1 in 175,223,510), and its minimum jackpot is $40 million.

Our brains aren’t really wired to intuitively grasp probabilities, and the marketing departments of big companies know this. With McDonald’s eclectic mix of a hand full of large prizes and a ton of small prizes, it’s clear they’ve put some serious research into what will get customers through their doors. And it works. Hell, the only time of year I eat at McDonald’s is when they run this contest – though I always sort of regret it later. It’s a fun contest, but I think knowing the odds gives you a more clear picture of what to expect.

The Basics

  • There are 651,841,628 game pieces in play. Each game piece contains 2 stamps.
  • 156,210,425 prizes will be given out.
  • The prizes falls into 4 categories: food prizes, instant wins, online prizes, and monopoly prizes. See the below table for a statistical breakdown.
Prize Category Number of Prizes Odds of Winning
Food 128,769,022 19.75%
Instant Win 25,780,151 3.95%
Online 1,661,242 ??? (see below)
Monopoly 1,359 0.0002084862245%

Chance of Winning Illusion

There might be some interesting psychology going on with how the game is played. Each game piece is 2 stamps, making you feel like you have 2 chances to win. However, the official rules only talk about the odds of game pieces, not stamps. This makes me wonder if only the game pieces matter, which would mean that at least one stamp on a game piece is always a loser. This would mean that half of the stamps you peel are just there for psychological effect of playing the game. You end up feeling like you have twice as many chances to win, when in reality, its just an illusion.

Unfortunately it’s hard to confirm this hypothesis. If the odds of a game piece winning are 25%*, then each stamp should have an individual winning probability of 13.4%**. This means the odds of both stamps winning on a game piece are 1.8%***. This means you’d need a really large same set to confirm that both pieces can’t win. I have around 56 stamps from friends and family, none of which were double winners – but that doesn’t mean much, since the odds of getting a double winner with 28 game pieces is only 40% (1 – 0.982^28). To be over 99% certain that double winning pieces don’t exist, you’d need to peel at least 254 game pieces.

This is just a theory though, and it could all be easily disproven if a double winning stamp shows up. This should happen 1.8% of the time, so if you’re really hungry you can test this out.

* The rules claim you have a 1 in 4 (25%) chance of being a winner. However, this number is rounded. If you add up the number of prizes and compare it with the number of pieces, you see that the number is closer to 24%.

** I worked backwards for this number by finding the probability of both stamps not winning: (1 – 0.134) * (1 – 0.134) = ~75%

*** Both stamps winning would have a probability of 0.134 * 0.134 = ~1.8

Odds for Rare Pieces

I’ve seen some sites structure their odds around finding a complete monopoly, but that’s just silly. There are only two types of pieces: rare ones, and ones that show up all of the time. If you find one of the rare pieces, you’ve basically won the prize.

Stamp Odds Prize Number Available
Mediterranean Avenue 1 in 651,842 $50 1000
Vermont Avenue 1 in 144,583,163* Free Gas for a Year ($2,350 ARV) 4
Tennessee Avenue 1 in 2,429,970 Mobile Wallet Prize ($3,150 ARV) 238
Virginia Avenue 1 in 690,723,394 $5,000 5
Short Line 1 in 57,833,265 $5,000 Target Shopping Experience 10
Ventnor Avenue 1 in 8,691,222 Beach Resort Vacation ($6,500 ARV) 75
Kentucky Avenue 1 in 32,592,082 Delta Vacation ($7,500 ARV) 20
Water Works 1 in 162,960,407 $10,000 4
Pennsylvania Avenue 1 in 1,686,343,601 Cessna Private Jet Trip ($16,900 ARV) 2
Boardwalk 1 in 651,841,628** $1,000,000 1

What do these odds mean? The best analogy I found was on a page for grasping large numbers. It gave the following example of how big 100,000,000 was: if you stacked 100,000,000 one dollar bills on-top of each other, they would reach 6.79 miles into the sky. That’s high enough to touch an airplane at cruising altitude.

* These odds appear to be wrong, as they differ from Water Works which also only has 4 stamps available. However, this is what the rules page lists.

** The Boardwalk odds come from the rule page, however, the winning stamp is apparently guaranteed to be on a Big Mac. If you focus your energy on eating Big Macs, this means your odds of winning are 1 in 37,955,000.

Online Game

Not much has been written about the online game, there are two main reasons for this:

  • There are no set odds. This is because the chances of winning are based on how many people decide to play their pieces online.
  • The prizes are very “meh”. Most of the 1,661,242 prizes are Red Box Rentals (1,400,000) and My Coke Rewards Points (250,000). However, there are a few decent prizes, and there is a top prize of $50,000.

Your odds of winning the $50,000 prize are the number of stamp codes you submit to the total number stamp codes submitted. Based on the 56 game stamps I’ve entered in, 3 were red box rentals. Extrapolating that out, the red box rental odds could be 1 in 20, which would mean McDonald’s expects 28,000,000 stamps to be entered in. This would mean your chance of winning the 50k per game piece would be 1 in 14,000,000. Now, 3 data points is too small a data set to make this assumption, so this should be thought of as just a back of the envelop calculation.

However, assuming these odds were true, that would mean if you spent the next week buying Hash Browns and entering in the max number of stamps a day (10), you could bring your odds of winning the 50k up to 1 in 400,000. This seems like a neat idea until you consider that if you spent the same amount of cash ($35) on Maryland Monopoly Lotto tickets, you would have a 1 in 385,031 chance of winning twice as much.

Food Items with Stamps

For those interested, Hash Browns have the best price to stamp ratio.

Name Price # Stamps Price Per Stamp
Bacon Clubhouse $4.69 2 $2.35
Big Mac $3.99 2 $2.00
Egg McMuffin $2.79 2 $1.40
Egg White Delight McMuffin $2.79 2 $1.40
Fruit & Maple Oatmeal $1.99 2 $1.00
Filet-O-Fish $3.49 2 $1.75
Hash Browns $1.00 2 $0.50
Large Fries $2.19 4 $1.10
Medium Fountain Drinks $2.49 2 $1.25
Medium or Large Hot McCafe Drink $2.59 – $3.39 2 $1.30 – $1.70
Premium McWrap $3.99 2 $2.00
Sausage McMuffin with Egg $2.79 2 $1.40
10-piece McNuggets $4.29 2 $2.15
20-piece McNuggets $4.99 4 $1.25

For legal reasons, McDonalds also allows you to request free pieces through the mail. A couple of individuals tried this out by requesting 500 pieces and comparing the outcome to buying 500 hashbrowns. It’s neat as an experiment, but unless you’ve got a lot of free time, you’re best bet is just buying Hash Browns.

Conclusion

Unless you’re in the mood for McDonald’s, don’t make your lunch decision based on the Monopoly Game. If a game of chance is what you’re after, you’re better off playing the lottery. However, if you’re going to McDonald’s anyway, get an item with pieces, as the game does make their food experience a little more fun.
Visualizing bls.gov data for CS related jobs

In honor of labor day weekend, I thought it might be fun to create a visualization of data from the US Bureau of Labor’s website. For those unfamiliar with the BLS, here’s a quick run down from wikipedia:

The Bureau of Labor Statistics (BLS) is a unit of the United States Department of Labor. It is the principal fact-finding agency for the U.S. government in the broad field of labor economics and statistics and serves as a principal agency of the U.S. Federal Statistical System. The BLS is a governmental statistical agency that collects, processes, analyzes, and disseminates essential statistical data to the American public, the U.S. Congress, other Federal agencies, State and local governments, business, and labor representatives.

Included in this data collection is worker compensation, which is normally a pretty secretive topic. Many companies have rules prohibiting you from discussing your salary with colleagues, and it’s almost always a terrible idea to tell someone your salary. But not knowing what other people are making makes it hard to judge if you’re being paid fairly or not. This is why these stats are so interesting.

On their page for Computer Programmers, they provide the data they’ve collected as well as a number of tables and map visualizations, relating to employment rates and salary. Even though these tables and maps cover a lot of ground, the raw data set has a lot of information that isn’t shown on the page, like the 10th, 25th, 75th, and 90th percentile rankings for all of the different geographic areas measured. I thought it might be cool to try and come up with an interactive visualization that allowed you to easily see and explore this information.

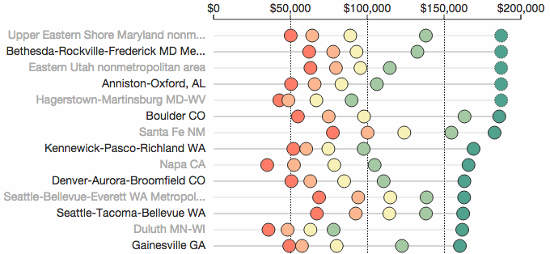
You can see what I came up with here, or just check out the screen cap below (there’s over 480 areas in the actual chart, so below is just the top 14 best paying areas – for “Computer Programmers”).

salary-data

As you can see above, I decided on a chart where each geographic area was on its own line and its percentile data was color coded and plotted on a linear scale. I felt this made it easy to scan through the data and prevented any information from being hidden. I also put in some filtering options so you could narrow the data down to compare specific areas and specific job titles (e.g., Software Developer or Computer Programmer).

Computer Programmer vs Software Developer?

For some strange reason, the BLS has decided to distinguish between “Computer Programmer” and “Software Developer”. This goes against what many people think of when they hear the titles, and I honestly think it messes up their data set.

Initially I was confused when Maryland ended up in the top two spots for “Computer Programmer”, and it wasn’t until I read the fine print that I realized what was going on. The BLS defines a Computer Programmer as follows:

Create, modify, and test the code, forms, and script that allow computer applications to run. Work from specifications drawn up by software developers or other individuals. May assist software developers by analyzing user needs and designing software solutions. May develop and write computer programs to store, locate, and retrieve specific documents, data, and information.

They then define a “Software Developer, Applications” as:

Develop, create, and modify general computer applications software or specialized utility programs. Analyze user needs and develop software solutions. Design software or customize software for client use with the aim of optimizing operational efficiency. May analyze and design databases within an application area, working individually or coordinating database development as part of a team. May supervise computer programmers.

Aye yai yai, whoever created these definitions doesn’t know the field. I imagine a lot of people marked themselves down as “Computer Programmer” without realizing what the BLS thinks it means. It’s even clear from the stats that they’ve captured. For example, “Santa Fe NM” has really high paying jobs for “Computer Programmers”, but so-so paying jobs for “Software Developers, Applications”. If Computer Programmers really answered to Software Developers, this wouldn’t make any sense.

Which title a person chose was probably due to its regional use, and since the BLS has decided on their own definitions, the stats can’t be completely trusted. However, I still think they’re interesting, and I’ve gone ahead and added several Computer Science-related fields to the visualization’s Options section. At the very least, I think the stats give a good idea of the range in pay for different areas.

Anyway, I put this together mostly because I thought it would be a fun little project. I’m not a payroll expert, and I’d honestly take this information with a grain of salt, so please don’t make any major life decisions after playing around with the visualization.

Creating a d3.js Game of Thrones Visualization

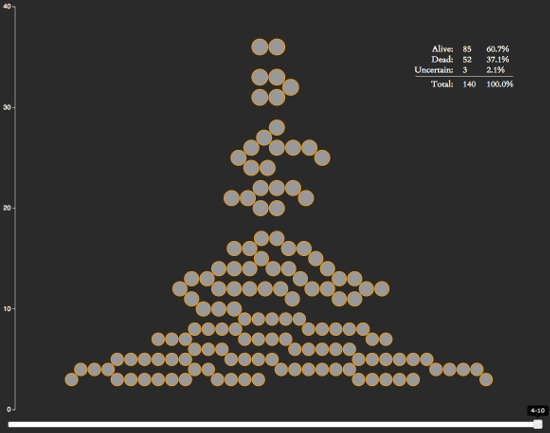
For any Game of Thrones fans out there, I’ve created a neat little interactive visualization. It ranks characters by how many episodes they’ve been in, makes note of who’s alive and who’s dead, and allows you to go backwards in the show’s history to see how things have developed over time.

It also reveals some interesting stats:

  • After 40 episodes, the show has around ~140 notable characters.
  • The show seems to kill an average of 13 notable characters per season, or 1.325 per episode.
  • 37.1% of the notable characters have been killed off so far.

You can see a spoiler-free version of the visualization below (character avatars and death information has been removed):

d3_got

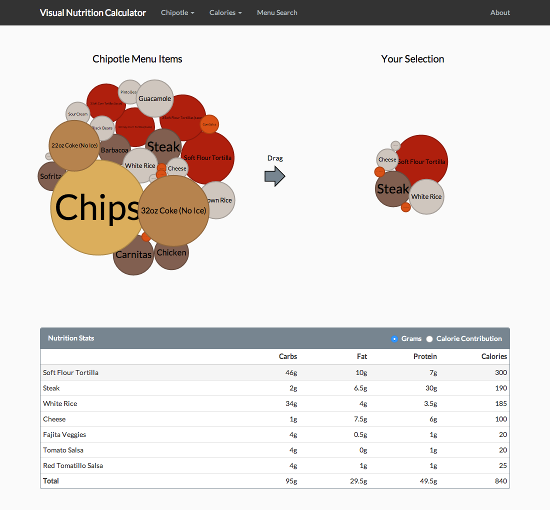
The chart is written on top of d3.js, which is a web-based visualization library. I learned how to use it earlier this year and have been on the lookout for projects I could use it for. After seeing the bubble chart from Matthew Daniels’s Largest Vocabulary in Hip Hop visualization and noticing it was based on an example by Amelia Bellamy-Royds, I decided to see if I could create my own bubble chart.

D3 Context Menus

I didn’t see any d3.js context menu plugins while doing this project, so I wrote my own. I could have used a jQuery plugin, but I wanted to keep as much of the code within the D3 way as possible (it just made working within their event structure easier).

Other Game of Thrones Visualizations

So there’s are plenty of other Game of Thrones visualizations out there. If you’re looking for more, I’ve compiled a short list below of some of the best ones I’ve found.

  • Events in the Game of Thrones – A visualization of the events from the first 5 Game of Thrones books.
  • Game of Thrones Map – Interactive map of the Game of Thrones universe.
  • Beautiful Death – A piece of artwork drawn for each episode in the show. I’m not sure if this technically counts as a visualization, but they’re pretty cool.

Bug Bounty Redux

A couple of weeks ago I was having one of those Fridays where I was just kind of dragging. Right before I was about to clock out and go pick up my son, a message from “Facebook Security” popped into my inbox. Since I hadn’t submitted any reports since last year, I was confused. Was this because I had done something wrong? Was my account hacked?

I opened the message and read the following:

Remember this report? 🙂 Definitely an unusual timeline and one that should have been much, much shorter. We do have a fix for this that we’re finally working to deploy. We hadn’t forgotten about your report, though, and we still want to send a bounty of $1500 in appreciation. Again, it should have been sent way sooner, but we appreciate your patience with us and I assure you this timeframe is not the norm.

Whoa, what a way the end a week! I had to reread the submitted report twice to remember what it was about.

Last year I briefly got into bug hunting and had ended up submitting a few vunerability reports. This particular report was put in late last Fall. It was kind of a complicated exploit, and for it to work, you either had to lock down your own friends list and target one or more of your friends, or target someone who had their own friends list locked down. Once that step was out of the way, you could setup your webpage to detect when these particular people visited your site. I thought it was too minor, but ended up submitting it after my office mate told me to go for it.

Originally I had heard back from Facebook’s security team that they were looking into it, but shortly after that correspondence I submitted two other reports and subsequently forgot about this one. Even though it’s been a while, it’s pretty cool they didn’t forget about it. Due to it being pretty obscure / minor, I wouldn’t have batted an eye if they had ignored the report.

Bing Bugs

I had a similar experience with Microsoft’s Security Center last year, though the outcome was more of a buzz kill. I had decided to take a look into their bounty program, and after poking around a bit, I found some CSRF bugs in Bing Rewards. The bugs allowed any third party web site the ability to check and see if a visitor was a member of Bing Rewards, to get their point count, and to change some of their settings (like what their reward goal was). Even though none of this was a big deal, I thought it was enough to at least get listed on their acknowledgments page.

Sadly I was mistaken. After I filed the report they generated an internal ticket and the bug was passed around. Then it was radio silence. 4 months later I got an email with this message:

We investigated the reported issue and the behavior is by design to ensure Rewards user can earn credits. We will be closing this MSRC case, please let me know if you have any questions.

None of that made any sense. My impression was they didn’t care and just wanted to close out one of their old tickets. It made me a little sad, but thankfully I didn’t spend too much time investigating their services. If I ever get back into bug hunting, I now at least know to avoid their program.

patorjk.com Scrolling Text Time Waster Bug

A couple weeks ago a friendly visitor named Cayd reported a Path Disclosure bug in my Scrolling Text Time Waster. There’s no bounty program for this site, but it was definitely cool that he shot me an email letting me know about it. Since I’m now writing an article on bug hunting, I figured I’d give him a shout out.

Une Bobine Review

phone

My wife’s phone

A couple weeks ago I was offered a review copy of an Une Bobine. The device looked kind of fun, so I decided to try it out.

Une Bobine is an iPhone charger, sync, and stand that’s made from a flexible metal cable. This cable can be bent and shaped to create unique setups. In the pic to the right you can see it twisted both into a practical stand and into a stand where I’m just seeing how high I can get the phone. The pluses for this device are that you can facetime without needing to hold onto the phone, that you can take time lapse photos, and that you can shape the cable so that it isn’t in your way.

The product made its original debut into the marketplace in 2012 after a very successful Kickstarter campaign. This success ended up breathing life into the small company behind the device, and since that time they’ve repeated this recipe by funding most, if not all, of their products through either kickstarter or indiegogo crowd sourcing campaigns. I mention this only since it’s kind of interesting – 10 years ago this kind of company probably wouldn’t have been able to exist.

Anyway, to give the product a thorough look I let my wife take it to work for a few weeks to see what she thought. It seemed pretty durable and she liked that the cable didn’t get in her way. It was also fun to play around with, making it sort of like an adult tech toy. The only negatives either of us could see with the product were that you couldn’t have your phone in its case while charging and that it was a little troublesome to use in the car. If you choose to use it in your car, you will want to test out your setup to make sure it wont fall over or get in the way of the radio.

Overall its a fun product. If you’re looking for a tech device to play around with, it’s something that can provide you some entertainment and utility while you’re at your computer. Lastly, the cable’s name is a little strange, but that’s because it’s French. Translated, “Une Bobine” simply means “a coil”.

Analyzing My Facebook Activity Log

Have you ever wondered what your Facebook likes say about you? And if there are any people whose posts you seem to favor? I was curious, so I decided to dig around and see if I could find some stats for likes. I couldn’t, so I decided to turn to the Facebook API. Unfortunately its like information seemed limited for privacy reasons*. Next I tried to get the information from the export feature Facebook offers. Sadly it didn’t have this data either. However, the activity log page chronicled my like history and was just what I was looking for.

I loaded as much information from this page as I could (for some reason it breaks for me around March 2012), and saved it off to a file. I then wrote a quick script to process the data and plugged my activity log into it. The results that were spit out stated that over the past two years I’d liked 1,088 posts and that of my 133 friends, half of my likes were going to just 5 of them (~4%).

Even more interesting, these 5 people were all family members. I’m not sure if that’s just a side effect of me interacting with my family more than my friends, if my family just posts a lot, or if I’m just ignoring my friends. Whatever the case, I didn’t realize I had such a bias with my likes. Though then again, if my Activity Log wasn’t broken for the pre-2012 time period, I wonder if the results would have been different. I had my first child in 2012, and I like most pics with him in it, so that could have been skewing the results. Also, come to think of it, my dog died last year and I went back and liked a lot of pictures of him in it, so that could be skewing things too.

Though peculiar, I’m only one data point, so an analysis of my data doesn’t really say anything about anyone else. If you’re curious about your own liking biases, I’ve put the script online as a gist.

Other Analysis

I’m not the first person to want to analyze their data. Wolfram Alpha has an online app that does an in-depth analysis of a person’s Facebook data. And while it delivers a treasure trove of neat information (example: my friends fall into 5 different groups of connected users), it fails to say much about likes.

Other, less public tools**, have been developed to comb through this like data though. Dr. Jennifer Golbeck gave a Ted Talk last Fall on what your likes say about you and how they’re used by companies. In it she mentions how researchers were able to correlate IQ with people who liked the Facebook page “Curly Fries”. She also mentions how many other attributes such as sexuality and religion can be predicted to a high certainly based on what you like.

It’s probably a no-brainer big companies like Facebook and Google are mining this info for ad purposes. I couldn’t find information on Facebook’s analysis, but Google actually provides a page where you can see what they think of you. However, it’s pretty simple, and I’d be surprised if that was all they had.

Conclusion

I’ve only done a simple analysis of my own data, so there’s a lot more to say for this subject. However, it was kind of eye opening to see where most of my likes were going. Additionally, I think it’d be interesting if there was an app you could use to analyze your own data to see what it said about you. Golbeck joked about starting a company that would sell reports about potential employees to HR people – but, I think it’d be useful if people could generate those kind of reports about themselves. It could help you learn things about your subconscious behaviors or possibly better control your online image.

* Before posting this, I revisited the Facebook API, and I think the data I gleaned from the activity log could also have been retrieved through a bunch of FQL queries. If I were to write a proper app, I’d probably try and use FQL, however, writing a script to parse the activity long was pretty quick and painless.
** I could only find studies, I couldn’t find any source code.

Book Review: “Ghost in the Wires: My Adventure as the World’s Most Wanted Hacker”

I wrote this review back in November of 2011. While cleaning out my blog’s draft folder I realized I’d never gotten around to posting it. Since it’s a good tech/geek read, I figured it was better late than never.

Ghost in the Wires

I went on vacation recently and needed a book for the rather long plane ride. After reading a sample chapter of Kevin Mitnick’s new autobiography, my interest was piqued. I had remembered reading about him and the “Free Kevin” movement back in ’98, and at the time I didn’t understand why people were getting behind this guy. He did a bunch of bad stuff, why should he be free? Since it’d also probably cover some interesting computer security topics, I figured it be both educational and entertaining. I picked up a copy and by the time I was arriving home, my hopes had been met.

Mitnick gained massive media attention in the mid-to-late 90’s when he was on the run from the FBI for various hacking related offenses. He was eventually captured, and spent 5 years in prison. In his new autobiography, “Ghost in the Wires”, he chronicles his escapades and details how he compromised so many systems. Surprisingly, it mostly through something called Social Engineering, which can loosely be defined as “the manipulation of people to get them to do what you want”.

Mitnick’s tales typically involve him just calling up his target, and simply convincing them to give him certain information or do certain things for him. For example, he was able to compromise the Social Security Administration by pretending to be an investigator from the Inspector General’s Office. He convinced a staff member there of his status, and for several years was able to use her to get privileged information. Here’s an excerpt of where he discusses the ruse:

I said, “We’re going to be needing assistance on a continuing basis,” explaining that while our office was working on a number of fraud investigations, we didn’t have access to MCS — short for “Modernized Claims System,” the amusingly clumsy name for their centralized computer system.

From the time of that initial conversation, we became telephone buddies. I was able to call Ann and have her look up whatever I wanted — Social Security numbers, dates and places of birth, mother’s maiden names, disability benefits, wages, and so on. Whenever I phoned, she would drop whatever she was doing to look up anything I asked for.

Mitnick comes off as smart and very curious, and a lot of his stories are very interesting, but it’s hard to like the guy. He ends up causing a lot of people grief and some of the decisions he makes made me want to facepalm. He continues to hang out with his best friend after the guy steals his wife (this same friend later tries to offer him up to the FBI), he strings along “Eric” even though he suspects the guy is working for the FBI, and he continues to do high profile system break-ins while he’s on the run. Though then again, if he hadn’t made these nutty decisions, there probably wouldn’t be a book to read.

The book starts off a little slow, but takes off once Mitnick goes on the run from the FBI for 2 years. During this time he assumes several identities, lives in a hand full of cities, and breaks into numerous systems. He gleefully details the social engineering tactics he used to do all of this, but when it comes to the technical aspects of his crimes, the book does a little bit of hand waving. The lack of detail in this department was apparently due to a disagreement between Mitnick and his co-writer. Mitnick wanted more detail, while his co-writer wanted to keep the story moving. They comprised, so there are a few side boxes for the more technically inclined, but you typically just get the general idea of what happened.

Overall I thought the book was a fascinating read and a valuable look into how a very successful individual was able to break into many different systems. If you’re into computer security, or looking for a non-fiction thriller, this is something to check out.

Steve Case Confirms Zuckerberg as Former AOL Hacker

vader-faderA year ago I wrote about Facebook founder Mark Zuckerberg’s possible AOL hacker roots. A 1999 angelfire website appearing to be his was uncovered, and it contained two AOL progs by “Mark Zuckerberg” – the Vader Fader and the Zuck Fader. The evidence that the Facebook founder had created progs in his youth was pretty compelling, and now AOL’s former CEO Steve Case has further verified this claim in his recent AMA (Ask Me Anything) by stating the following to someone who was apologying for their role in the AOL hacking scene:

Yikes! Well, I’m glad you got this off your chest! 🙂 The hacking of AOL was a real challenge for us. As AOL grew in prominence, it became a big target. Of course, some of the hackers have gone on to do more productive things. It sounds like that is the case with you, and it also was the case with Mark Zuckerberg! Went I first met him 6 or 7 years ago he said he learned how to program by hacking AIM! But, thankfully, rather than focusing on bring AOL down, he shifted to build Facebook up!

This probably means the Zuck had a collection of progs, knew about the various AOL *.bas files, and knew about AOL ASCII Art. That’s kind of cool when you think about it. I imagine he’s the most famous former AOL hacker.

Thanks to Kevin M. for alerting me to Steve Case’s post.

Sea Change

wwwA little over a year ago a coworker pitched a snunkworks-type project to myself and another team member. Separately the three of us worked on PHP/MySQL and Java/Oracle projects, but he wanted the new project to use the MEAN stack (MongoDB, Express.js, AngularJS and Node.js) since JavaScript was something we all had in common.

My interest was piqued, but I was a bit skeptical. I felt the stack was a little too trendy, and for whatever reason, I singled out AngularJS as something I wasn’t so sure about. I felt it was too new – something that was hot at the moment, but might not be hot in 6 month’s time.

At my insistence, we spent a couple weeks comparing Angular and Backbone.js, a framework which had a more established reputation. By the end of our comparisons though, I had done a 180 and was completely sold on Angular. For the remainder of the development I focused mostly on the Angular side of things and loved it.

At the same time I also enjoyed Node. However, its async nature was kind of a pain in the ass and its biggest benefit was really just keeping a common language across the whole project. For Mongo, I had mixed feelings. The flexibility was kind of cool, but relational databases, with their transactions and joins, are a lot easier to work with. Mongo and Node were neat, but they both had weaknesses you had to be careful about. Angular, however, really felt like something that would be a good fit for any type of web project – large or small, complex or simple, etc etc.

GSe3vyI__The experience left an impression on me, and a few weeks ago I decided to accept a job offer at a new company as an AngularJS developer. It was kind of hard to leave my old job, as I really enjoyed it, but I felt it was time to venture out into new waters.

It’s neat to think that 5 years ago I was programming test equipment in Tcl/Java, and now I’m a front-end Angular guy. I guess that’s just the nature of software development though, you’re always continuing to evolve. Also, like always, work wont get mentioned in this blog again unless its related to a major life change, so in my next post I’ll be back to talking about some random tech topic or updates to this site.

Speaking of which, updates to this site have been kind of sparse lately, and I’m sorry about that (especially if you’ve submitted as keyboard layout because I’m way behind in reviewing those). The job switch ate up a lot of time, and a planned vacation to Chile also ate up a lot of time, but now that those two events are over with, I hope to get back to more regular updates.

Also, in case you’re interested, the images in this post come from RedditGetsDrawn, a very cool place where artists draw pictures of submitted photos.

Nomad ChargeKey Review

DSC_0082I don’t normally do reviews of tech devices, but I was recently offered a review copy of Nomad’s ChargeKey, and since it seemed like a neat little device, I decided to check it out.

ChargeKey is a portable lightning cable that fits on a keychain. It comes in both a lightning (iPhone) and micro-usb format (Android / Windows Phone). The idea behind it is to allow people to always have a cable to plug-in to a USB port if they need to charge or sync their phone. If you use a laptop or have a keyboard with a USB port this is really convenient. The cord is also flexible, so technically you could also plug it into the a USB slot on the back of a desktop tower too.

Priced at $29, it costs $10 more (or 53% more) than a normal lightning cable from Apple. This means you’re basically paying $10 more for the added convenience of a short portable cable. That’s a little high, but not too bad.

One thing I’m not completely certain on is its durability. Their marketing material mentions that its made with “high grade plastics from Bayer”, but I wasn’t able to find any information on if it was water proof (so I assume its not). I also wonder about the long term wear and tear the device can take, though for something this new its probably too early to tell. After 3 weeks I haven’t encountered any problems though.

Other than that, there’s honestly not a whole lot to say. It’s a simple product that lives up to its expectations. If you think its something you’d like, I’d definitely recommend it.